Video GamerX's Code
Like the Beta Quest, there have been tons of goodies that the programmers
left behind, and this code ranks second on the list, Beta Quest being first.
This code was used when the programmers were debugging the game, and whenever
it froze the programmers just entered in the code and voila! All of the
addresses called, the stack and heap, the error, floating point values,
everything they needed. How useful this information was depended
on the kind of crash you had, since most programming errors won't set off
any alarms until it's already too late. Nonetheless, many games incorporate
debug "dump" functions, though the number that are compiled with these
features still usable remains relatively low.
Thanks to DVDMTH, a Zelda fan and computer sciences major, we now have
the accurate description of these screens. Fortunately, I
wasn't too far off.... err... well, not too far. Just a little....
some.... stop looking at me like that!!
This procedure is also the most accurate way of finding out which
version of Zelda 64 you have.
Okay, first we need the game to freeze. The easiest way to do this is
to do the crooked cartridge trick (slowly pull on the left side of the
cartridge until it freezes, then shove it back in). Then look in the upper-lefthand
corner. If you see a small yellow line, then it worked. If you can't
see the line, then either your TV has cut it off or you didn't do it right
(try again). Once you see the yellow line, grab your controller and enter
in:
L+R+Z
D-Up+C-Down
D-Down+C-Up
D-Left+C-Left
C-Right+D-Right
A+B+Start
If it worked, then the majority of the screen should be covered by a
black box (sometimes it shows a small box that says "RCP has hung up...
oh MY GOD!" or something like that). If you have a Gameshark or have worked
with codes then you'll recognize the hexadecimal addresses listed, and
at the top a variety of error messages show up:
0: Interrupt - A very rare message, since interrupts are not
usually considered errors. Interrupts are commands used to grab the
processor's attention, such as a key press or a click on the mouse.
Since almost all interrupts are handled by the software, this should never
cause the game to crash.
1: TLB Modification Exception - Also very rare, in this case.
TLB stands for Translation Look-Aside Buffer, which
is how the processor accesses virtual memory. In this case, the program
tried to change an address that was stored in either a ROM chip or was
otherwise protected.
2: Error on Loading TLB - This means that one of the type libraries
that was supposed to be compiled into Zelda 64 is either missing or modified.
This normally happens with the Beta Quest, and definitely sounds suspicious.
Unfortunately, if the TLB wasn't compiled into the game, then it's nearly
impossible to "fix" it.
UPDATE: Heh... okay, I was wrong. The TLB definition I
had used was for C++, where TLB stands for Type Library Build.
However, this is CPU talk, so we're using the TLB definition we had above.
Here's the actual explanation: In this case, the game tried to access
an address (normally a variable or function call) that wasn't in the virtual
memory or in the cartridge's compiled data. This isn't too far from
my explanation, since the error could be caused by a missing data type.
However, it could also be triggered by attempting to read a command when
it wanted a variable, or vice versa, or even by trying to load a texture,
arena, or character mesh (which is technically just more variables).
3: Error on Saving TLB - This means that one of the type libraries
was modified and the game attempted to save it, but it didn't work. This
could also mean that it created a TLB in memory and attempted to save onto
either the cartridge or a fixed disk drive that used to be there, but isn't
there anymore.
UPDATE: Same mistake here, and again not too far from the truth.
What actually happens is that the game attempted to write into an address
that didn't exist. This could be anything from trying to save to
a nonexistent file to trying to change a variable in virtual memory that
was never initialized.
4: Error on Address Load - This means that when the game attempted
to read an address in the memory, the address was either too high or it
was not what the game expected and caused the freeze. This normally happens
when you try to use the "nameless" items (check the item
modifier code for more information).
UPDATE: According to DVDMTH, this error only occurs when the game
tries to access a RAM address illegally (a 00?? address, or byte address,
that was an odd number, or a ???? address, or word address, that wasn't
divisible by four), or when it tries to access a RAM address that was reserved
for a different process (unlikely, since the processor is only running
the Zelda process). Also, a process is another word for a program.
UPDATE 2: A little wiser now, address errors can also occur when the
game tries to access a variable outside of its current scope, which is
a common problem with any computer program.
5: Error on Address Save - This means that the game attempted
to save onto an address, but either the address was part of the ROM, or
it did not work correctly. This also happens when you try the "nameless"
items, as well as the Beta Quest. Because it attempts to write onto the
ROM, the N64 may try to transfer the save to a different address, which
could cause complications (in other words, it could erase files).
UPDATE: Apparently, this error can be caused only by the above reasons
as well, though it is still possible that the game will try to transfer
the save to an "unused" address.
11: RCP is Hung Up - The Reality Co-Processor is vitally important
when the N64 works its 3-D wonders, and when it freezes, so does the N64.
If you get this message, then the stack and heap dump screens, object ID,
and arena screens will not show.
UPDATE: This error is normally extremely rare. However, because
Crooked Cartridge can create thousands, if not millions, of faulty commands
in milliseconds, the co-processor can easily become inundated and prevent it from functioning.
[Filename]... - The debug tool was intended for the programmers,
who could access the actual C++ files used in making the game. So they
made sure the debug screen was smart enough to know the filenames. Well
the filenames are still stored in the debug screen (you can see them if
you use Gameshark's View Code command), and whenever the screen mentions
one of them, then you crashed the game itself, which is somewhat difficult
to do.
15: Floating Point Exception - The Floating Point Unit (a piece
of hardware specially designed to handle numbers with fractional values)
couldn't make heads or tails out of the last instruction it was given,
was told to divide by zero (which is impossible), the number was too big,
or the number was too small. Usually it says "Invalid Operation,"
which means that it was totally confused. (Note: most of the time it
will say "inexact operation," which simply means that the fraction is longer
than the FPU can hold. This almost always results in rounding, so
it is not considered a crash.)
Here's a more detailed description of each screen:
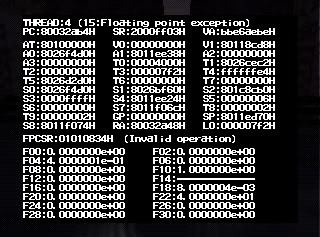 QUICK MEMORY DUMP & FLOATING POINT VALUES
I do not know everything about how this works, but I'll try to be as
accurate as possible. This screen is a basic memory dump that displays
the last addresses called. These are used so programmers can trace
back to where the glitch occured. The very top also displays the
error that caused the crash. In this case, it was a floating point
exception.
Some further details: the "thread" is the part of the program that
crashed. In this case, it was the fourth thread started by the Zelda
process (program; it's always this thread, just to let you know).
PC stands for Performance Counter, which is the location
of the next instruction being called (normally the one causing the error).
The other 32 are data registers, or special areas in the processor where
often-used variables can be stored. One of these is a pointer to
the stack (used to find the next command in waiting), labeled here as SP
(Stack Pointer). The rest are floating point numbers
being processed in the FPU, which only has fifteen slots usable (the other
fifteen are merely extensions of the first fifteen, otherwise the decimals
would only extend out to four decimal places.
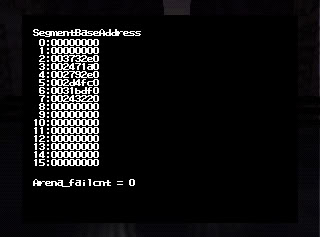
BASE ADDRESSES & ARENA FAILURES
I have no idea what segment base addresses are... but there are sixteen
of them. DVDMTH theorized them as part of a checksum, but we really
don't know for sure what it is. Underneath is an Arena Fail Count.
An arena is a world made of polygons. For example, Kokiri Forest
is an arena. Signs, rocks, bushes, people, pots, and other stuff
are called "objects," and are not actually part of the arena. They
are instead declared and spawned after the arena is made. So far,
I haven't any instance where this fail count was above zero. (Note:
the Arena fail-count is my assumption. For all I know, it could be
something else. However, it seemed to be the only logical explanation,
so I'm going to stick with it until proven otherwise.)
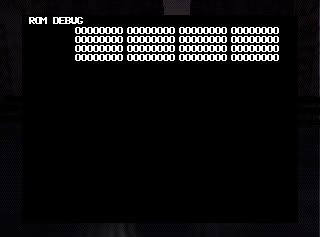
ROM DEBUG
DVDMTH theorized that this was an exclusive debug screen where the
program could pass specific information to display here to give the programmer
a clearer picture of what went wrong. Makes perfect sense to me,
but we might be wrong.
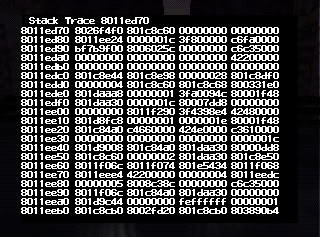
STACK DUMP
The stack is where pending commands are queued until the N64 is free.
This list of addresses are all of the commands that were either still waiting
to be issued, or the last ones used. The location of the next command
to be called is located right next to "Stack Trace" and is usually the
topmost command.
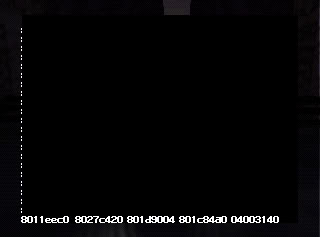
 BLANK SCREENS
The stack is of variable length, so in the event that the stack takes
up more than one screen it extends onto these blank ones. So far,
that never happens except for one line.
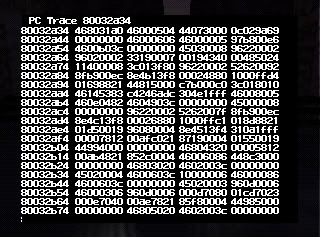 PC DUMP
DVDMTH seemed uncertain about this and theorized that this was the
next set of instructions to be executed (assembly language format).
I think that this isn't too far from the truth, since the Performance Counter
only tracks instructions and not return values, variables, or other miscellaneous
information like the stack does, the PC tracer would simply be an array
of addresses that the PC value has held. The current PC value is
then displayed next to the text label.
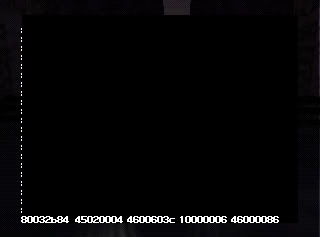
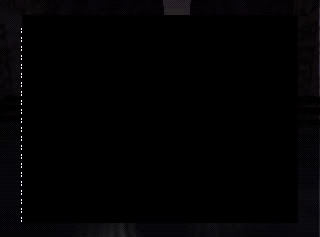
 BLANK SCREENS
Again, since these arrays are defined by the program itself, the size
is variable, so just in case the trace needs more pages, it can use these.
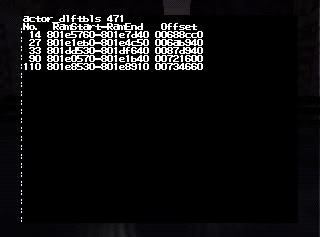 ACTOR LIST
Actors are the characters in a game or any object that has "states,"
like a signpost. Most either move, walk, or talk. Although
Link is an actor, I've seen this screen blank, so he doesn't appear here.
The addresses next to each Actor Number are the memory segments that contain
all of the information about the actor. You can manipulate actors
through these addresses, but it is dangerous unless you know what you're
doing. The offset... I'm not exactly sure what that is.
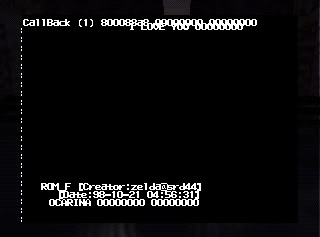 CALLBACK SCREEN
This screen is somewhat easier to understand. CallBack is a function
initialized by the debugger that can allow the game to view extra pages
or information not normally included. The message "I LOVE YOU" was
left by the programmers for no actual reason (you can change this message
temporarily on a Gameshark using the Memory Editor to anything you want...
once you turn off N64, though, the message reverts back to normal).
The Creator thing is the ROM Debugger programmer's e-mail address.
It's missing the network extension, so we are not sure what it was supposed
to be. The date and time is when the game was either compiled or
when the debugger was added. OCARINA is the program name, and the
two addresses next to it are the first addresses to the program.
BACK